


DeCoSTAR is a software that aims at reconstructing the organization of ancestral genes or genomes in the form of sets of neighborhood relations (adjacencies) between pairs of ancestral genes or gene domains. It can also improve the assembly of fragmented genomes by proposing evolutionary-induced adjacencies between scaffolding fragments. Ancestral genes or domains are deduced from reconciled phylogenetic trees under an evolutionary model that considers gains, losses, speciations, duplications, and transfers as possible events for gene evolution. Reconciliations are either given as input or computed with the ecceTERA package, into which DeCoSTAR is integrated. DeCoSTAR computes adjacency evolutionary scenarios using a scoring scheme based on a weighted sum of adjacency gains and breakages. Solutions, both optimal and near-optimal, are sampled according to the Boltzmann–Gibbs distribution centered around parsimonious solutions, and statistical supports on ancestral and extant adjacencies are provided. DeCoSTAR supports the features of previously contributed tools that reconstruct ancestral adjacencies, namely DeCo, DeCoLT, ART-DeCo, and DeClone. In a few minutes, DeCoSTAR can reconstruct the evolutionary history of domains inside genes, of gene fusion and fission events, or of gene order along chromosomes, for large data sets including dozens of whole genomes from all kingdoms of life. We illustrate the potential of DeCoSTAR with several applications: ancestral reconstruction of gene orders for Anopheles mosquito genomes, multidomain proteins in Drosophila, and gene fusion and fission detection in Actinobacteria.
Availability:http://pbil.univ-lyon1.fr/software/DeCoSTAR (Last accessed April 24, 2017).
Introduction
Colocalization of genes along a chromosome, or combinations of domains within a gene are genomic features that evolve and can be gained or broken by rearrangements. We will use the term gene to designate an evolutionary unit (a gene or a domain or any smaller or larger module), and we call adjacency the link between two genes. An adjacency thus represents either the link between two contiguous genes on a chromosome, or the link between two domains of a protein, or may also represent the link between two genes fused into a single gene. The evolution of adjacencies is usually modeled differently for different scales (Pasek et al. 2006; Ma et al. 2006; Wu et al. 2013; Stolzer et al. 2015), complex gene histories are rarely handled in ancestral organization reconstruction, and models integrating fusions and fissions of genes are called for (Haggerty et al. 2014).
We describe a software, DeCoSTAR, which reconstructs putative ancestral states of adjacencies, for example, ancestral domain structures of a modular protein, as well as chromosome organizations of whole ancestral genomes, or fusion/fission histories or modular genes, when genes have complex histories made of gain, duplication, transfer, speciation, and loss events.
The input of DeCoSTAR consists in a species tree, a set of extant gene families—each in the form of one or several gene trees—and extant adjacencies between pairs of extant genes.
The gene trees and the species tree follow the reconciliation framework that is described by Jacox et al. (2016). (Reconciled gene trees are rooted gene trees whose nodes are associated to an evolutionary event, such as speciation, gene loss, gene duplication, or lateral gene transfer, and to a position in the species tree. Numerous methods exist to build reconciliations, see Åkerborg and Sennblad [2009], Bansal et al. [2012], Stolzer et al. [2012], and Szöllosi et al. [2015] for example.) The species tree may be dated or not, and gene families may be provided in the form of a gene tree sample, a single gene tree, or directly a fully reconciled gene tree. Reading direction (orientation) of genes on the chromosome may be given or not. Accordingly, ancestral genes are directed or not in ancestral organizations.
The output consists of adjacencies between ancestral genes along with evolutionary scenarios composed of gains and breakages of adjacencies. DeCoSTAR optimizes on a linear combination of the number of gains and breakages of adjacencies along the species tree. It can sample among optimal solutions, and thus give a statistical support to each inferred adjacency. It can also sample in the space of suboptimal solutions using a Boltzmann–Gibbs distribution centered on the optimal solutions. As an option, it is possible to propose, based on the adjacencies in other species, adjacencies that are not in the input between extant genes; these new adjacencies can be used to improve the assembly of extant genomes.
Note that input adjacencies depicting the linear organization of chromosomes do not guarantee the same linear organization in ancestral genomes. We provide in the distribution a linearization method (Manuch et al. 2012) to transform the output in a linear organization if needed.
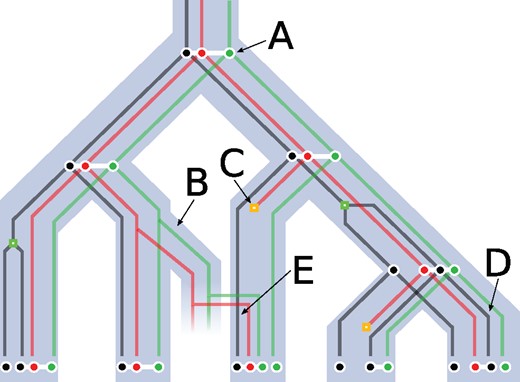
A species tree (light blue), three reconciled gene trees (black, red, and green) (losses are orange squares; duplications are green squares) and a set of extant and ancestral adjacencies linking genes (white). (A) An adjacency is inherited by both sister species after a speciation occurs. (B) An adjacency between the red and green gene is transferred, and so are both extremities of this adjacency. (C) The red gene undergoes gene loss and thus both adjacencies it was a part of disappear. (D) The adjacency between the red and black genes disappears due to an adjacency break on the branch leading to the leaf. (E) An adjacency is gained between the black gene and the newly acquired red gene.
Features and Implementation
DeCoSTAR supersedes (with the exception of the ability of DeClone [Chauve et al. 2015] to compute the exact expectation of the frequency of a property of interest using a variant of the inside–outside algorithm) and combines all the features of DeCo (Bérard et al. 2012), DeCoLT (Patterson et al. 2013), DeClone (Chauve et al. 2015), and ART-DeCo (Anselmetti et al. 2015). The generalization of all these methods offers novel capabilities, including the Boltzman–Gibbs sampling of ancestral adjacencies in the presence of transfers from error-prone/partial genome assemblies. The integration with the software package ecceTERA dedicated to reconciliations (Jacox et al. 2016) adds novel features, such as the possibility of taking unrooted gene trees or undated species trees as input. As a novelty, it also fully handles gene orientations whenever available, and provides statistical supports of ancestral adjacencies by sampling among optimal solutions.
DeCoSTAR is a C ++ program requiring the Bio ++ library (Gueguen et al. 2013) and the Boost library (BOOST 2003) to be installed. It is a command-line program whose various options and input can be specified on the command line or given in a parameter file. It handles newick format for trees and recPhyloXML (Gence 2016) format for trees and reconciliations.
A detailed documentation of DeCoSTAR options, input and output formats is available in the supplementary material (Supplementary Material online) and is included within the distributed version of the software.
Algorithm
Given a set of adjacencies between extant genes, DeCoSTAR partitions it into homologous families. Two adjacencies a1a2 and b1b2 are homologous if a1 and b1, respectively a2 and b2, have a common ancestor i1, respectively i2, such that i1 and i2 are in a different gene tree or, if they are in the same gene tree, one is not an ancestor of the other. This relation is transitive, yielding a partition of the full set of input adjacencies into families.
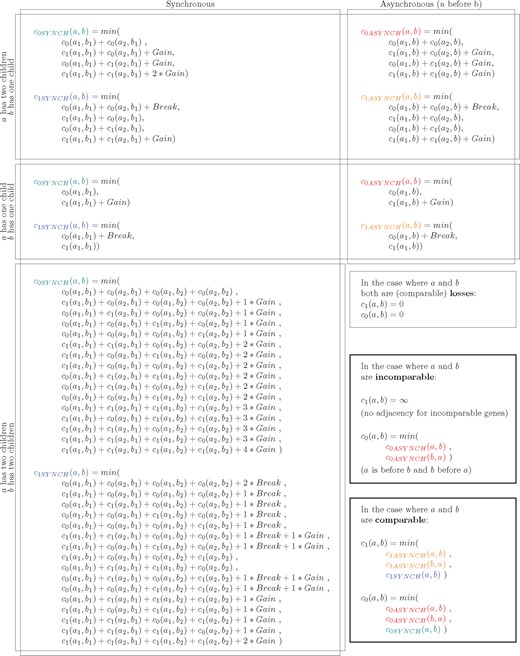
For each family of homologous adjacencies, a minimal cost adjacency history, that is, a history that minimizes the number of adjacency gains and adjacency breakages weighted by their respective costs, is computed. This is done in a dynamic programming matrix following a generalization of the propagation rules described in Patterson et al. (2013) (see table 1 and below where we introduce the notation we use).
Description of the Propagation Rules under Different Situations
 |
|
Description of the Propagation Rules under Different Situations
|
|
Once the dynamic programming matrix of has been computed, backtracking on this matrix permits to produce an evolutionary history for the family of homologous adjacencies. This history takes the form of ancestral adjacencies (linking ancestral nodes of the gene trees) and the events they undergo. Events may occur to individual genes or to pairs of genes linked by an adjacency, in which case it is called a coevent. A coevent implies that the events from two different reconciled gene tree nodes are part of a single event spanning multiple genes.
DeCoSTAR allows multiple backtracks of the dynamic programming matrix in order to form a sample of adjacency histories, either within optimal solutions or according to a probability space defined by a Boltzmann–Gibbs distribution centered on the optimal solutions.
Each propagation rule is translated into a specific term in a dynamic programming equation for the reconstruction of ancestral states. The complete set of rules (19 rules, whose combinations cover all the cases encountered by the algorithm) implemented in DeCoSTAR is the result of a complete rewriting of a combination of rules taken in the previous softwares, aggregating them in more general rules. For comparison DeCoLT (Patterson et al. 2013), a less general algorithm, used a set of 23 rules.
For two genes a and b, we note c1(a,b) and c0(a,b) the cost of, respectively, having an adjacency and having no adjacency between a and b. We call a1 and a2 (respectively, b1 and b2) the children of a (respectively b) (NB: if a [respectively b] only has one child, then a2 [respectively b2] does not exist).
We denote by Gain the cost of a single adjacency gain. We denote by Break the cost of a single adjacency breakage. Two gene tree nodes a and b (from the same gene tree or not) are said to be comparable if they are in the same species, if they are in the same time slice when relevant, and if one is not an ancestor of the other. Otherwise they are said to be incomparable.
If the events at a and b (deduced from the gene tree/species tree reconciliations) occurred simultaneously (which is only possible if they are comparable), we call them synchronous. Otherwise we call them asynchronous and have to take into account if the event at a occurred before the one at b or the opposite.
The different formulas of the propagation rules are combinations of different cases where a and b are comparable, synchronous and how many children they have.
The different case formulas are presented in table 1. In the asynchronous cases, only the number of children of the events that happens first (a in the figure) matters.
An exception to these rules occurs in the specific case where a and b or their children are considered to be in an extinct or unsampled lineage of the species tree (Szöllosi et al. 2013). In these specific lineages event of adjacency breaks are not counted in the cost function.
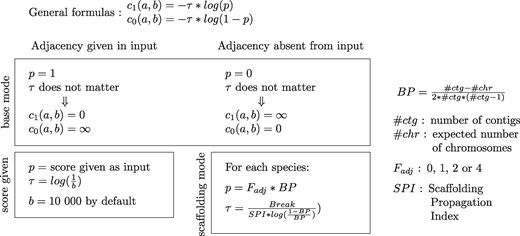
If a and b both are leaves, the score associated to the presence of the adjacency relies on the adjacencies given as an input. If the scaffolding mode is used, then the formulas at the leaves follow the ones described in (Anselmetti et al. 2015), as described in table 2.
Description of the Score between Leaves
 |
|
note.—The two parameters Fadj and SPI used in the scaffolding modes, respectively, account for the position of the genes in their contig and the repartition of poorly assembled genomes in the species tree; both parameters are described with more details in the supplementary material, Supplementary Material online. The scaffolding mode and score given option can be used simultaneously as they affect a different set of adjacencies: respectively, the adjacencies absent from the input and the adjacencies given in the input.
Description of the Score between Leaves
|
|
note.—The two parameters Fadj and SPI used in the scaffolding modes, respectively, account for the position of the genes in their contig and the repartition of poorly assembled genomes in the species tree; both parameters are described with more details in the supplementary material, Supplementary Material online. The scaffolding mode and score given option can be used simultaneously as they affect a different set of adjacencies: respectively, the adjacencies absent from the input and the adjacencies given in the input.
If Boltzmann sampling is used, then the formulas undergo the same changes described in Chauve et al. (2015). Namely, every occurrence of the + operator becomes a product, functions become sums, and any event cost EventCost becomes , where T corresponds to a pseudo-temperature (the higher the temperature, higher the probability for nonparsimonious scenarios to be sampled). The costs between two leaves also follow a similar transformation.
Results
We tested DeCoSTAR on several biological data sets in order to demonstrate its versatility in various contexts. The first example shows a combination of options previously implemented separately: Boltzmann sampling on the adjacencies and the inference of new extant adjacencies in 18 mosquito genomes under an evolutionary model where only duplications and losses are allowed.
The two other data sets show the application of DeCoSTAR in a context different from gene order reconstruction: protein modular architecture evolution, shown on a set of drosophila genes in which we reconstruct ancestral adjacencies between protein domains, and a history of fusions/fissions between bacterial genes in the presence of transfers. Note that such applications where previously discussed (see, e.g., the conclusion of Patterson et al. [2013]), but had never been demonstrated.
Eighteen Anopheles
We selected 14,940 gene families in 18 mosquito species from Neafsey et al. (2015). Gene trees were constructed with RAxML (Stamatakis 2014) and corrected with ProfileNJ (Nouhati et al. 2016) (keeping all branches with a 100% bootstrap support and correcting the others to minimize duplications and losses in a reconciliation with a species tree).
A sample of 100 solutions was generated according to a Boltzmann distribution with temperature 0.05. As the genomes are not fully assembled, we added the possibility of proposing extant adjacencies (the scaffolding mode). Combining these two options (sampling and extant adjacencies proposition) is a specificity of DeCoSTAR as they were hitherto only available separately.
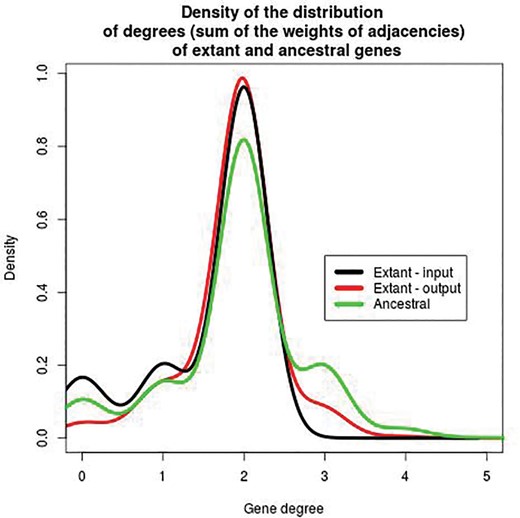
Density of the distribution of the degree of all genes inferred by DeCoSTAR on the 18 Anopheles data set. The degree of an extant or ancestral gene is the sum of the weights of all adjacencies containing this gene. For extant genomes in the input (black line), this value can only be 0, 1, or 2. For genomes in the output, extant (red line) or ancestral (green line), all values are possible because adjacencies have scores between 0 and 1, and a gene can belong to an arbitrary number of adjacencies. The difference between the black and red lines are due to the scaffolding: genes with 0 or 1 neighbor are linked to other genes as an output of DeCoSTAR. In ancestral genomes, some genes have degree three or slightly more.
Fly Protein Domains
DeCoSTAR can also be applied to protein domain architecture. When doing so, gene trees become domain trees, evolving along a species tree. Proteins are not modeled explicitly but are rather formed by groups of domains linked together. Thus, the resolution slightly differs from a similar previous approach proposing to reconcile domain trees with gene trees (Stolzer et al. 2015). For example, the transfers of domains from one gene to another result in a sequence of adjacency gains and breakages, while they were modeled as singular events there. We exhibit an example of such an application on the protein domain families described in Wu et al. (2012). It features 22,867 protein domain families in nine fully sequenced fly genomes. Of these, we kept the 12,906 protein domain families that have at least one extant copy that is part of an extant multidomain protein. Protein domain families were aligned using MUSCLE (Edgar 2004) and their trees were inferred using RAxML (Stamatakis 2014) with the appropriate model (inferred using the RAxML perl helper script for finding the best protein substitution model). The adjacencies used as input reflect neighborhood relationship between domains of the same extant protein.
There are in average 5,278 proteins per extant species in the input data set with an average protein size of 2.030 domains. DeCoSTAR was used to infer ancestral adjacencies forming an average of 4,977 proteins per ancestral species, for an average protein size of 2.188 domains. As with the validation on the Anopheles species data set, some ancestral protein domains have been erroneously inferred with more than two neighbors, leading to the presence of some nonlinear proteins in the ancestral species. Nonlinear proteins should be seen as several linear proteins erroneously linked together. Their presence decreases the total number of proteins and increases the average number of protein domains per protein, which would explain the difference in average number of proteins and average protein size between extant and ancestral species.
A Fusion–Fission History in Actinobacteria
Adjacencies can be used to denote the fact that two genes are fused into one. To illustrate this, we use a set of three gene families from the HOGENOM database (Penel et al. 2009) that we, respectively, call A, B, and C. In all Actinobacteria present in HOGENOM, the A and B genes are always present together, but never with C genes. Furthermore, in a profile alignment, A and B both align on disjoint, consecutive regions of C, covering nearly 98% of its length. We use this signal as the marker that A and B genes fused in order to give C genes.
To reconstruct the history of this system, we manually cut each C gene into its parts that, respectively, aligned with A and B, added them to the alignment of the family with whom they aligned and put an adjacency between the newly formed gene so that we could account for the fact that they fused.
We used an option of DeCoSTAR that specifies that an adjacency at the root of its history should not be penalized by a gain, as we do not make any assumption about the ancestral fissioned or fusioned state (which is not the case for ancestral genome reconstruction for example, where an adjacency can always be considered as gained in some root branch of the phylogeny). Moreover, we set the event costs so that an adjacency break (corresponding to a fission event), costs four times as much as an adjacency gain (corresponding to a fusion event), following the results of (Kummerfeld and Teichmann 2005; by default, from the gene order context, an adjacency gain costs twice as much as an adjacency break).
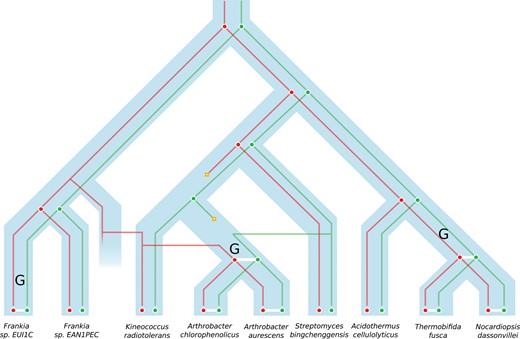
A schematic representation of the results obtained for the fusion–fission data set, following the schema described in figure 1, and with adjacency gain marked by an upper G. Family A and B are represented as reconciled gene trees, respectively, in red and green. The presence of an adjacency denotes the fusion of A and B to form the family C.
Conclusion
There exists an extensive set of bioinformatics tools aiming at reconstructing the history of an evolutionary unit, as a gene or a domain or a gene concatenate. But they all make the assumptions that, inside a unit, all sites have the same history, and that two units are independent. The inter or intra unit organization is rarely modeled, with the effect of missing an evolutionary view on what the living is essentially made of: organization and interaction. Here, we propose to depict this interaction in the form of adjacencies between units, where the units can be genes, gene domains, or parts of genes having different histories like in the case of fusions or fissions. We present a software—DeCoSTAR—that generalizes several algorithms published by our group, is easy to install and to use, allows a wide range of genomic events such as duplications, transfers, losses, rearrangements, and can deal with poorly assembled genomes. We demonstrate the utility of this software on a diverse set of very large biological data sets where taking the interactions between units into account is crucial. We show that a single methodological framework can account for diverse situations which were previously approached separately by ad-hoc methods. Up to changes in propagation rules, the same principle can also be used to reconstruct ancestral states of any binary relationship, such as protein interaction, regulation, or coexpression.
Supplementary Material
Supplementary data are available at Genome Biology and Evolution online.
Acknowledgments
This work was funded by the Agence Nationale pour la Recherche, Ancestrome project ANR-10-BINF-01-01. This work was performed using the computing facilities of the CC LBBE/PRABI.
Literature Cited
Author notes
Associate editor: Mary O’Connell
